AlchemyLeads Agency Overview
AI SEO & PPC proposal · Marketing audit
Full-stack revenue engineers for ecommerce and B2B brands: AI SEO, paid media, web, integrations and automation, measured in revenue.
Who we are & why you should work with us
Results first. Here is what the work did for four B2B clients. Client names are withheld.
Industrial cleanroom manufacturer
B2B · Modular cleanroom systems for manufacturingIndustrial graphics supplier
B2B · Industrial graphics and production solutionsPrecision equipment supplier
B2B · Industrial precision equipment providerProtective coatings manufacturer
B2B · Protective industrial coatings

Platform partners
Meta & Google, month by month
Two ecommerce accounts, the real monthly numbers, including 2026 year to date. Switch views and channels, then hover a month for the details.
See the monthly numbers
| Metric | Jan | Feb | Mar | Apr | May | Jun | Jul | Aug |
|---|---|---|---|---|---|---|---|---|
| Meta spend | $3,389.24 | $3,066.50 | $3,439.64 | $3,281.69 | $3,401.57 | $3,298.17 | $3,485.10 | $3,120.18 |
| Meta revenue | $39,442.23 | $79,268.97 | $62,039.22 | $57,386.13 | $61,526.81 | $34,850.31 | $78,278.60 | $55,073.79 |
| Google spend | $3,765.95 | $3,495.59 | $3,615.30 | $3,466.77 | $3,423.82 | $3,243.41 | $3,037.05 | $2,889.49 |
| Google revenue | $50,108.65 | $40,709.09 | $53,054.42 | $41,594.61 | $45,974.38 | $29,739.27 | $32,377.66 | $62,292.00 |
| Total ad spend | $7,155.19 | $6,562.09 | $7,054.94 | $6,748.46 | $6,825.39 | $6,541.58 | $6,522.15 | $6,009.67 |
| Total paid revenue | $89,550.88 | $119,978.06 | $115,093.64 | $98,980.74 | $107,501.19 | $64,589.58 | $110,656.26 | $117,365.79 |
| Shopify revenue | $109,400.00 | $146,065.07 | $138,646.67 | $153,594.33 | $141,699.42 | $117,872.73 | $138,836.39 | $163,553.07 |
| Total paid ROAS | 1,251.55% | 1,828.35% | 1,631.39% | 1,466.72% | 1,575.02% | 987.37% | 1,696.62% | 1,952.95% |
| TaCOS | 6.54% | 4.49% | 5.09% | 4.39% | 4.82% | 5.55% | 4.70% | 3.67% |
| Metric | Nov | Dec | Jan | Feb | Mar | Apr | May | Jun | Jul | Aug | Sep |
|---|---|---|---|---|---|---|---|---|---|---|---|
| Meta spend | $1,342.64 | $1,400.49 | $1,596.44 | $2,091.30 | $2,819.81 | $2,895.64 | $3,323.79 | $3,307.58 | $3,276.76 | $3,623.86 | $3,311.17 |
| Meta revenue | $31,223.16 | $13,528.74 | $12,686.67 | $16,351.02 | $26,026.07 | $25,006.32 | $16,183.48 | $32,658.78 | $25,692.95 | $27,630.75 | $50,694.36 |
| Google spend | $2,455.12 | $2,563.47 | $2,544.40 | $2,917.06 | $2,932.00 | $2,575.76 | $2,416.12 | $2,362.67 | $2,541.67 | $2,442.05 | $3,030.67 |
| Google revenue | $29,099.03 | $13,610.98 | $27,645.67 | $23,895.07 | $25,823.93 | $35,148.84 | $23,889.16 | $41,390.52 | $27,823.28 | $33,009.45 | $31,405.18 |
| Total ad spend | $3,797.76 | $3,963.96 | $4,140.84 | $5,008.36 | $5,751.81 | $5,471.40 | $5,739.91 | $5,670.25 | $5,818.43 | $6,065.91 | $6,341.84 |
| Total paid revenue | $60,322.19 | $27,139.72 | $40,332.34 | $40,246.09 | $51,850.00 | $60,155.16 | $40,072.64 | $74,049.30 | $53,516.23 | $60,640.20 | $82,099.54 |
| Shopify revenue | $75,930.77 | $75,780.32 | $93,849.68 | $89,597.18 | $122,760.00 | $111,230.00 | $98,016.61 | $99,062.99 | $120,764.51 | $112,805.99 | $113,517.86 |
| Total paid ROAS | 1,588.36% | 684.66% | 974.01% | 803.58% | 901.46% | 1,099.45% | 698.14% | 1,305.93% | 919.77% | 999.69% | 1,294.57% |
| TaCOS | 5.00% | 5.23% | 4.41% | 5.59% | 4.69% | 4.92% | 5.86% | 5.72% | 4.82% | 5.38% | 5.59% |
| Metric | Nov | Dec | Jan | Feb | Mar | Apr | May | Jun | Jul | Aug | Sep |
|---|---|---|---|---|---|---|---|---|---|---|---|
| Meta spend | $1,769.89 | $2,082.40 | $4,776.97 | $5,418.57 | $3,135.68 | $2,824.59 | $5,695.54 | $7,743.54 | $7,759.55 | $6,832.25 | $6,290.85 |
| Meta revenue | $21,470.51 | $29,655.63 | $28,752.70 | $30,075.96 | $36,568.53 | $31,899.69 | $40,707.02 | $51,030.26 | $57,184.61 | $60,174.59 | $44,153.20 |
| Google spend | $2,637.98 | $3,042.18 | $2,994.08 | $1,031.72 | $2,089.62 | $2,383.38 | $2,359.21 | $2,139.02 | $1,625.17 | $2,255.35 | $2,690.96 |
| Google revenue | $6,015.26 | $11,819.42 | $21,439.68 | $4,047.51 | $7,255.68 | $16,196.32 | $23,183.56 | $35,519.48 | $24,842.40 | $28,835.71 | $27,095.96 |
| Total ad spend | $4,407.87 | $5,124.58 | $7,771.05 | $6,450.29 | $5,225.30 | $5,207.97 | $8,054.75 | $9,882.56 | $9,384.72 | $9,087.60 | $8,981.81 |
| Total paid revenue | $27,485.77 | $41,475.05 | $50,192.38 | $34,123.47 | $43,824.21 | $48,096.01 | $63,890.58 | $86,549.74 | $82,027.01 | $89,010.30 | $71,249.16 |
| Shopify revenue | $60,563.77 | $55,123.27 | $65,606.62 | $67,951.11 | $99,793.88 | $77,709.19 | $88,143.33 | $100,222.33 | $107,952.49 | $99,039.81 | $86,477.01 |
| Total paid ROAS | 623.56% | 809.34% | 645.89% | 529.02% | 838.69% | 923.51% | 793.20% | 875.78% | 874.05% | 979.47% | 793.26% |
| TaCOS | 7.28% | 9.30% | 11.84% | 9.49% | 5.24% | 6.70% | 9.14% | 9.86% | 8.69% | 9.18% | 10.39% |
Proof, straight from analytics
Seven more clients across SEO, local and paid. Pick an industry to see its numbers, the screenshot behind them, and the client in their own words.
Wellness & supplements
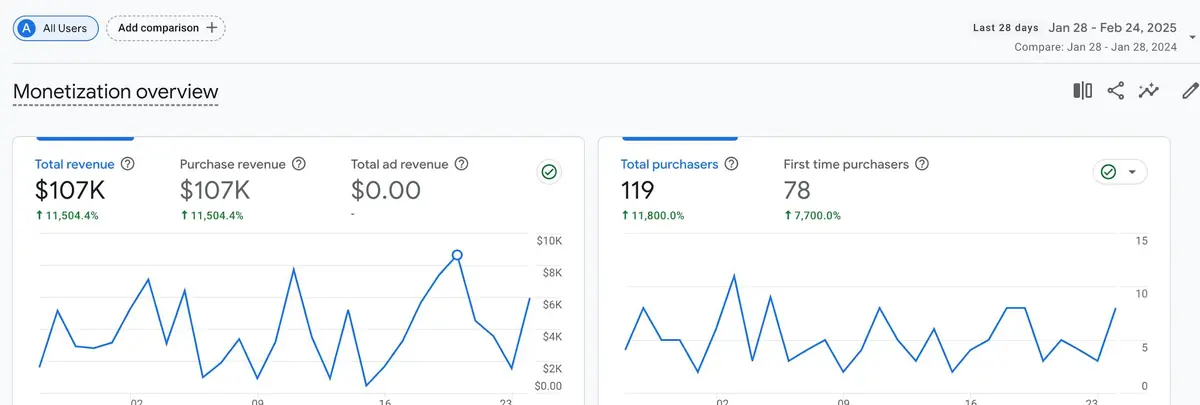
GA4 monetization overview, Jan 28 – Feb 24, 2025, compared with the same period in 2024.
Automotive
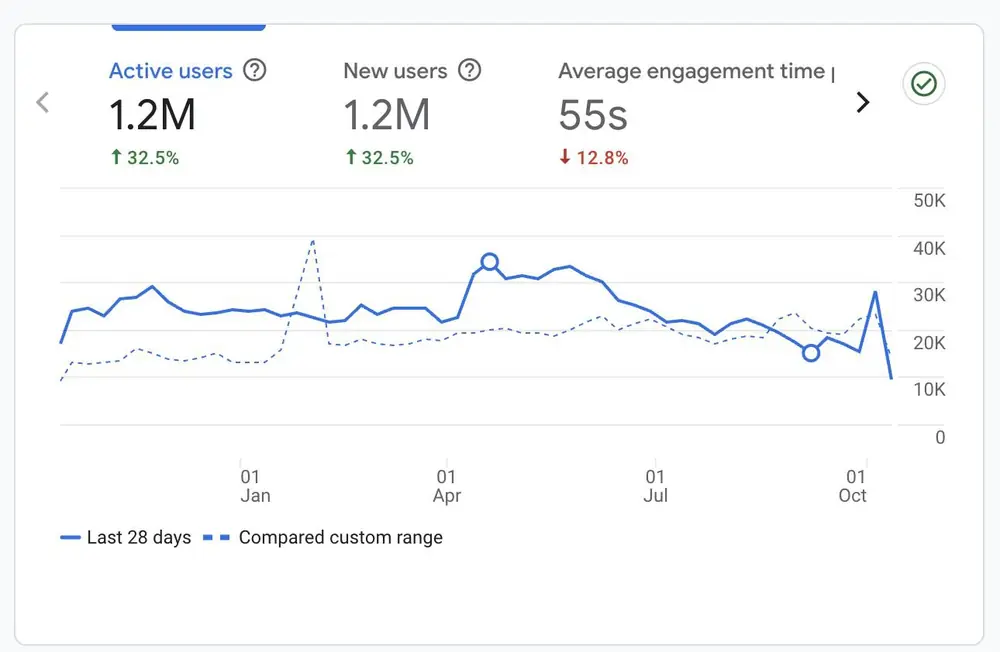
GA4 users over twelve months, compared with the prior period.
Event catering
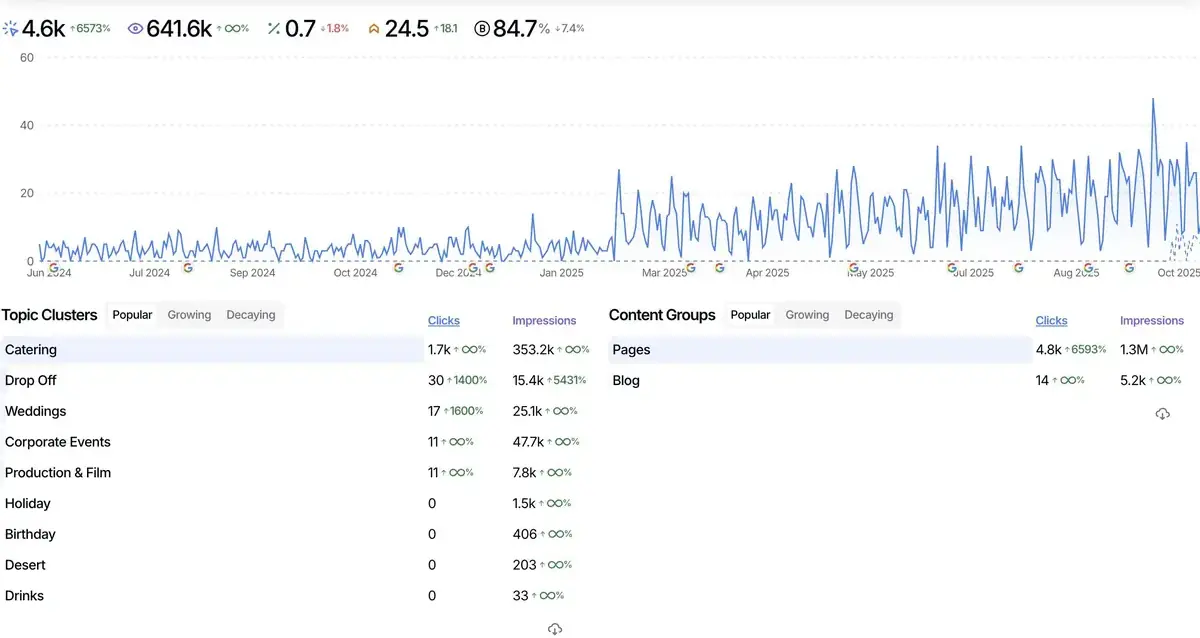
Search performance over 16 months, by topic cluster.
Coffee
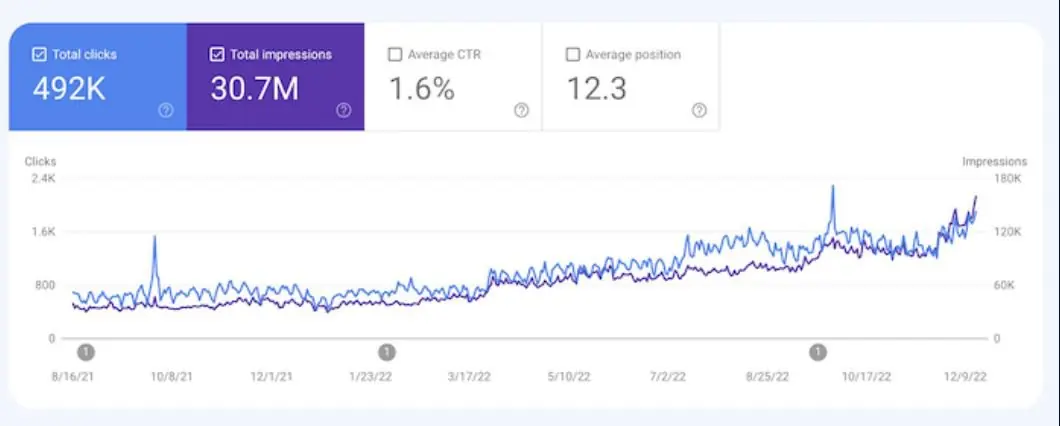
Google Search Console, August 2021 – December 2022.
Mortgage
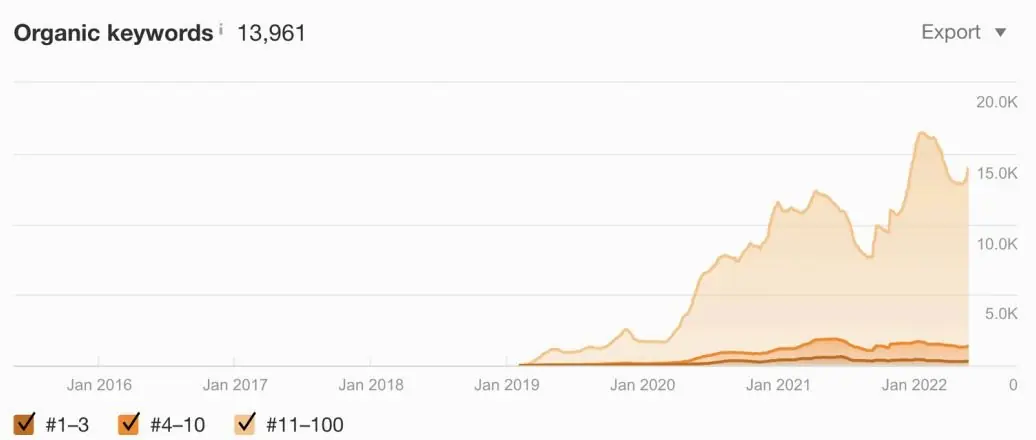
Organic keyword growth from 2019 to 2022 (Ahrefs).
3PL & fulfillment
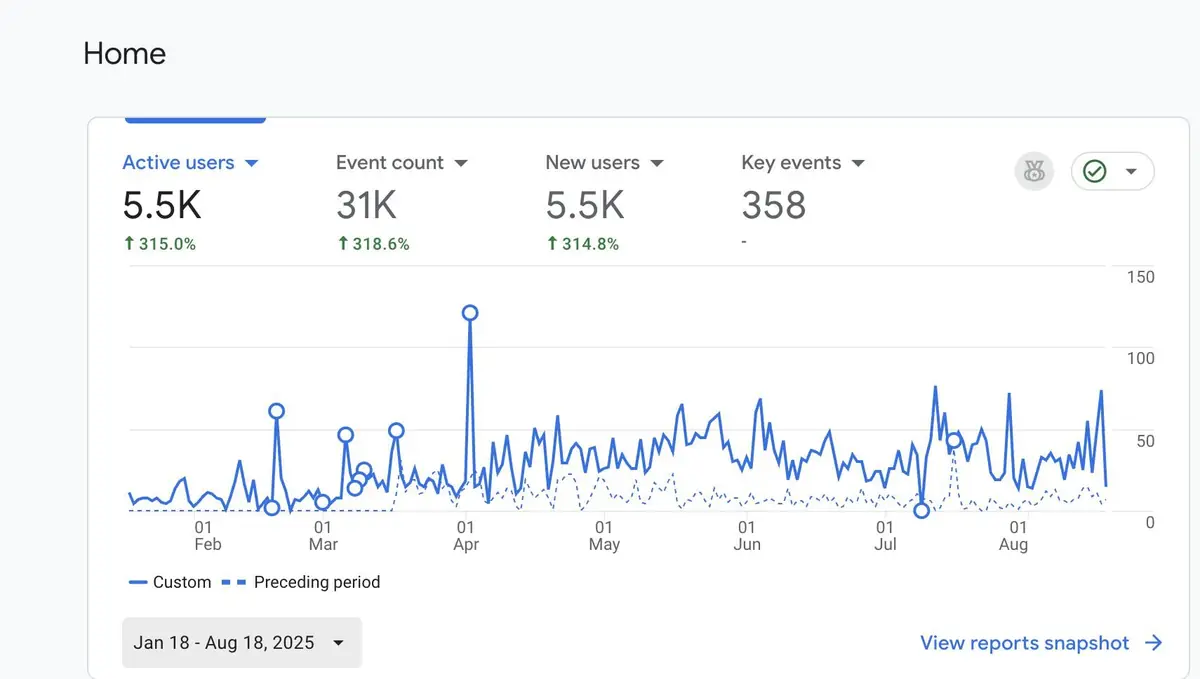
GA4, Jan 18 – Aug 18, 2025, compared with the preceding period.
Consumer electronics
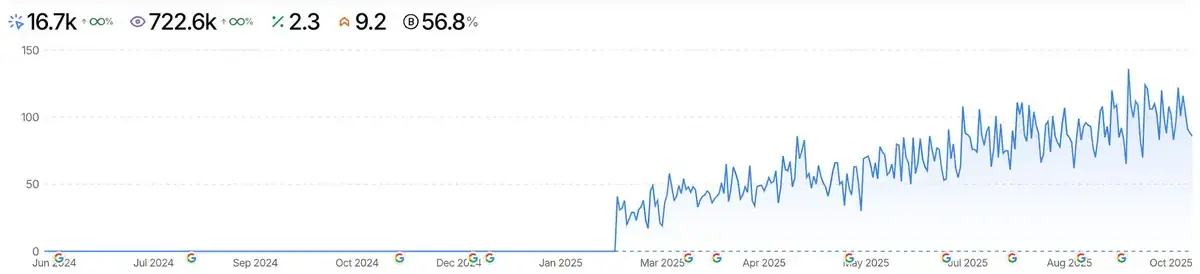
Search performance over 16 months; growth begins January 2025.
More than just an SEO agency
We are not only an SEO vendor; we are full-stack revenue engineers. We build the entire sales and marketing ecosystem for our clients, delivering end-to-end efficiency and measurable ROI. We aim to become the entire marketing operation of your brand.
Paid ads: Meta & Google
Stop gambling on clicks. We engineer Meta and Google campaigns for instant, measurable ROI. Paid traffic converts buyers now while SEO builds the brand equity and ROI foundation for the long term.
Web development & maintenance
Your website should be a zero-risk sales engine, not a cost. We engineer custom sites and connect the latest third-party applications, fully optimized for conversions, SEO and speed.
Technical integrations
End the data chaos and fuzzy attribution. We connect HubSpot, CMS and ERP systems so data flows accurately and disjointed tools become one sales machine that works as your source of truth.
AI agentic automation & workflows
We design agentic AI workflows for lead scoring, lead routing, personalized copy, support tickets and internal SOPs, using agents connected to MCP servers with custom webhooks and triggers. AI that pays for itself.
Email marketing
Unlock your existing database. High-converting email sequences turn cold leads into warm contracts, nurture trust and generate predictable ROI from the customers you already know.
Creative design
Design is revenue, not art. We build high-converting user experiences and visual assets for websites, ads and content, so your brand looks like the market leader.
Real-time comms, 24/7 dashboards & QBRs
Some clients don’t care about reports. As long as they’re getting more sales, they’re happy. If that’s you, we’re OK with that too.
We still share status updates as they happen, plus real-time communication in a dedicated Slack channel with the team running your campaigns every day.
We build real-time analytics dashboards, update your paid ads ROAS and TaCOS spreadsheets every month, and hold performance reviews monthly or quarterly, whichever cadence you prefer.
- Goals completed
- KPIs & benchmarking
- Analytics & revenue data
- Issues and concerns
- Upcoming tasks


Next steps
- Statement of work (SOW)
- Schedule an onboarding call
- Campaign launch