
The short version
We track the live ads of 68 competitors across 8 industries for our clients, pulled every week from the Meta Ad Library, the Google Ads Transparency Center and the LinkedIn Ad Library. Our first full pull caught 3,578 live ads from 50 advertisers. Almost half of them are plain feature showcases. The angles built on proof (customer reviews, guarantees, real results) are the rarest in the set, and they’re also the ones advertisers keep paying for: on Google and Meta, 89% to 94% of them have been running for 30 days or more. On Meta, not one of 21 discount ads made it past 30 days.
Why we track competitor ads at all
Every ad library shows you what a competitor is running today. On its own, that’s a mood board. The useful signal is time. Advertisers stop paying for ads that don’t convert, so an ad that has been live for 30, 90 or 300 days is the closest thing to a public performance report you’ll ever get from a competitor.
So we built a tracker for our paid media clients. Every Monday it pulls each competitor’s live ads, saves the copy and creative, and has an AI model tag every ad’s hook, angle, offer, format and proof. Anything live for 30 days or more counts as a winner. The competitor list for each client comes from organic search overlap, so it reflects who actually fights for the same buyers, which is the same starting point we use for a competitive analysis.
The dataset
This is the first full pull, taken on November 11, 2026.
| Industry | What the competitors sell |
|---|---|
| Specialty coffee equipment | Espresso machines, grinders, parts and accessories, mostly ecommerce |
| Plastic injection molding | Custom molding and on-demand manufacturing |
| Packaging and shipping supplies | Boxes, mailers, fulfillment |
| Car and marine audio | Speakers, amplifiers, subwoofers |
| Industrial gearboxes and drives | Gear reducers, motors, motion control |
| Cleanrooms | Modular cleanrooms and contamination control |
| Warehouse automation | Autonomous forklifts and mobile robots |
| SEO and marketing agencies | Our own competitive set |
3,578 live ads
From 50 of the 68 advertisers we track. The other 18 had no live ads in these libraries.
2,618 on Google
1,650 text, 665 image and 303 video creatives from the Ads Transparency Center.
960 on Meta and LinkedIn
354 Meta ads and 606 LinkedIn ads, each tagged for angle, offer and proof.
Finding 1: Almost everyone runs the same ad
45.6% of all 3,578 ads are feature showcases: a product, a spec, a capability, a clean shot on white. Authority and expertise ads, built on years in business, certifications and engineering depth, come next at 12.0%. Pain point ads are 5.1%. Every one of the 8 industries has feature showcase as its most common angle.
| Angle | Share of all ads |
|---|---|
| Feature showcase | 45.6% |
| Authority / expertise | 12.0% |
| Pain point | 5.1% |
| Education / how-to | 4.2% |
| Price / discount | 4.0% |
| Lifestyle / aspiration | 2.9% |
| Social proof | 2.8% |
| Comparison / us vs. them | 2.3% |
| Results / transformation | 1.3% |
| Guarantee / risk reversal | 1.2% |
| Founder / brand story | 0.5% |
| Urgency / scarcity | 0.3% |
The remaining ads were hiring posts (3.5%), event promos (2.3%) and ads the model couldn’t place in a single angle (12.1%).
If your ads read like a spec sheet, they look like nearly everyone else’s in the feed. That’s the same problem we see in organic content, and it’s why we push clients toward non-commodity content on the site too.
Finding 2: The angles that last are the ones almost nobody runs
Here’s where it gets interesting. We took the 2,972 Google and Meta ads and checked how many of each angle had been running for 30 days or more.
| Angle | Ads | Running 30+ days |
|---|---|---|
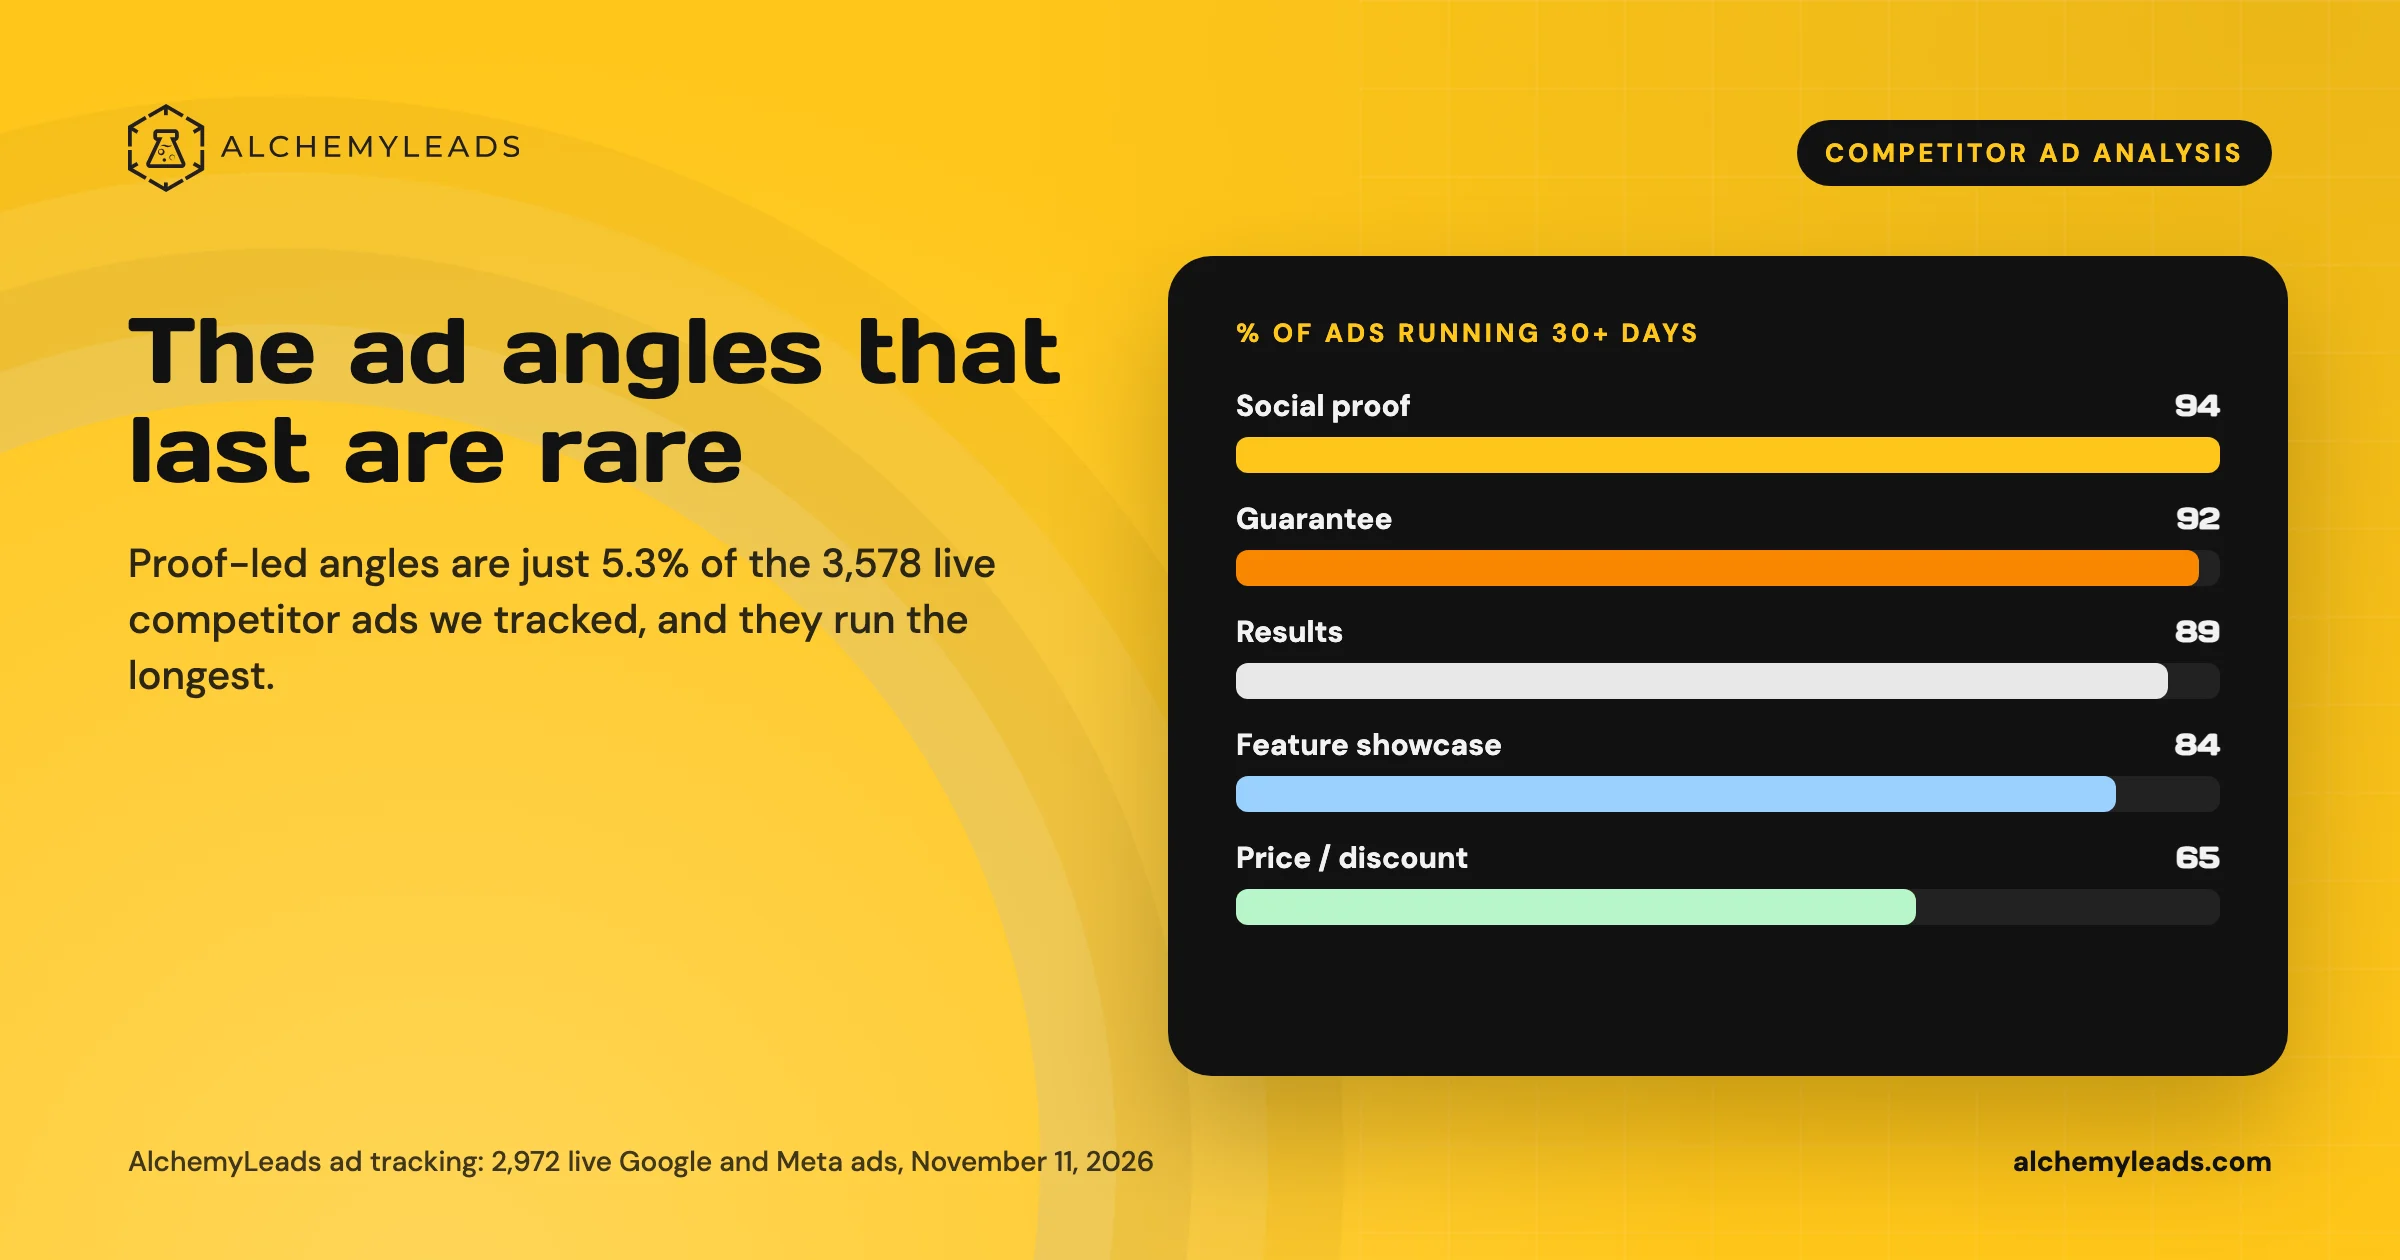
| Social proof | 62 | 94% |
| Guarantee / risk reversal | 38 | 92% |
| Authority / expertise | 340 | 91% |
| Results / transformation | 35 | 89% |
| Comparison / us vs. them | 65 | 86% |
| Feature showcase | 1,514 | 84% |
| Pain point | 92 | 73% |
| Lifestyle / aspiration | 97 | 68% |
| Education / how-to | 99 | 67% |
| Price / discount | 142 | 65% |
Three of the top four lean on proof: what customers say (social proof), what you promise (guarantees) and what you’ve already delivered (results). Together those three make up 5.3% of all ads, and they sit at or near the top of the survival table.
The sample sizes for those angles are small (35 to 62 ads each), so treat this as a strong pattern and keep testing it in your own account. Our read: proof is the scarcest thing in the auction, and the advertisers who have it keep funding it.
Finding 3: On Meta, discounts burn out and proof keeps running
We caught 354 live Meta ads. 51% had been running for 30 days or more, 51 had passed 90 days, and 7 had passed 180.
0 of 21
Discount and price ads on Meta that had run past 30 days.
21 of 21
Social proof ads on Meta that had run past 30 days.
57 days
Average run time for Meta video ads, vs. 50 for carousels and 33 for single images.
One honest note on that 21 of 21. 15 of those social proof ads, and 26 of the 38 Meta ads that had run 100+ days, come from a single packaging and shipping supplier. It runs a creator program: small-business owners filming themselves packing orders and unboxing the supplier’s boxes, published as paid partnerships. Our read is that one advertiser found a format that works and keeps paying for it. That’s the whole point of tracking competitors over time.
Discount ads are short by design, so don’t judge your own promos on run time. Judge them on sales. For the rest of your Meta advertising, run time is a useful early signal, and it pairs well with the ROAS math in our Facebook ROAS guide.
Finding 4: Most ads don’t ask for anything
53% of the ads make no offer at all: no trial, no quote, no sample, no discount, no download. 70% carry no proof: no stat, no review, no customer logo, no result.
Meta ads are the most likely to make an offer (263 of 354, or 74%). Google ads are the least likely (1,046 of 2,616, or 40%).
That’s an easy gap to close. A concrete offer plus one proof point already puts an ad ahead of most of the competition in these industries. We cover how to build that into B2B campaigns in our B2B Facebook ads guide and our PPC strategy breakdown.
Finding 5: Winners get cloned
785 of the 2,998 ads with readable copy, or 26%, share word-for-word copy with another ad from the same advertiser. One advertiser ran 25 versions of the same text.
That makes sense. When copy works, the media buyer re-runs it in new sizes, formats and placements. A line that has been cloned across a competitor’s account is a stronger signal than any single ad’s run time.
What this means for your ads
1. Sort by survival
Pull your competitors’ ads that have run 30+ days. Their newest ads tell you what they’re testing. Their oldest tell you what’s working.
2. Count the angles
Tag every winner by angle. Any proof-led angle that’s rare in your category and lasts in others is your opening.
3. Add one offer and one proof
Every ad gets a concrete next step and one piece of proof: a review, a number or a customer.
4. Judge promos on sales
Discount ads are built to end. Measure them on revenue and keep run time for evergreen creative.
5. Clone what survives
When one of your own ads passes 30 days, re-cut it in new sizes and formats before you write something new.
If you want the creative side handled too, our creative and video teams build from the same winner list. It also feeds our media planning and digital marketing audits.
How to read this data
- Run time is a proxy. Some advertisers leave ads running out of neglect. A long run time says “worth keeping”, and it falls short of proving profit.
- Google counts differently. Google’s library reports when an ad was first and last shown. We count the days between them, and an ad may have paused in that window.
- LinkedIn is left out of run times. LinkedIn’s library gives no start date for most ads (562 of 606), so we track them from the day we first see them and leave them out of these survival numbers.
- This is one snapshot. It’s the first weekly pull, from November 11, 2026. We’ll update this post with week-over-week survival as the data builds.
Frequently Asked Questions
How long do winning ads run?
We treat 30 days as the working threshold for a winner. In our dataset of 2,972 live Google and Meta ads from 8 industries, 82% had been running for 30 days or more, and on Meta alone the figure was 51%. Proof-led angles like social proof, guarantees and results claims had the highest 30-day survival rates, from 89% to 94%.
What is the best way to analyze competitor ads?
Track them over time and sort by how long each ad has been live. Then tag every long-running ad by angle, offer, format and proof, and count which angles your category overuses and which it ignores. The rare angles that still last are your best tests.
Which ad angle works best for B2B?
In our data, proof-led angles lasted longest: social proof (94% running 30+ days), guarantees (92%), authority (91%) and results claims (89%). Social proof, guarantees and results claims were also among the rarest angles, at 5.3% of all ads combined. Feature showcases were the most common angle at 45.6% of ads.
Where can I see my competitors’ ads?
The Meta Ad Library, the Google Ads Transparency Center and the LinkedIn Ad Library are all free and public. They show what’s live today. To see what lasts, you need to check them repeatedly or use a tool that saves each pull and tracks run time.
Want this for your competitors? We run this tracking for our paid media clients and turn the winners into creative, landing pages and AI search content. Book a strategy session and we’ll show you what your competitors have been running the longest.
Suggested
Competitor Ad Analysis: What 3,578 Live Ads Say About the Creative That Lasts
We tracked 3,578 live competitor ads on Google, Meta and LinkedIn. Proof-led angles are the rarest and run the longest. See the data and the playbook.
November 11, 2026
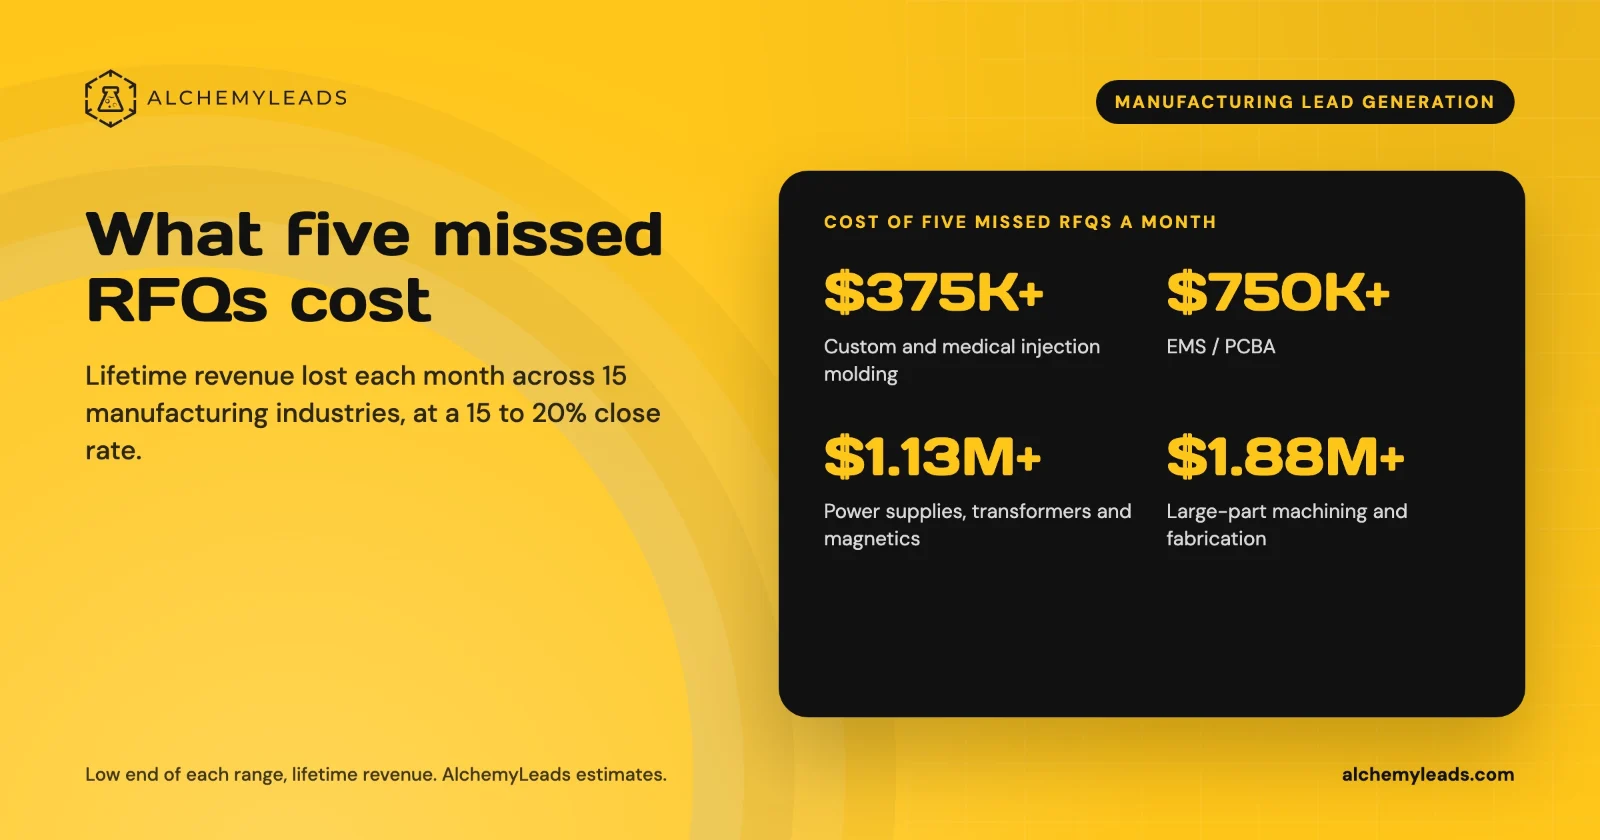
The Cost of Inaction in Manufacturing Lead Generation: What Five Missed RFQs a Month Cost in 15 Industries
What five missed RFQs a month cost in 15 manufacturing industries, with customer lifetime values, a conservative 15 to 20% close rate, and a cost of inaction calculator.
October 27, 2026
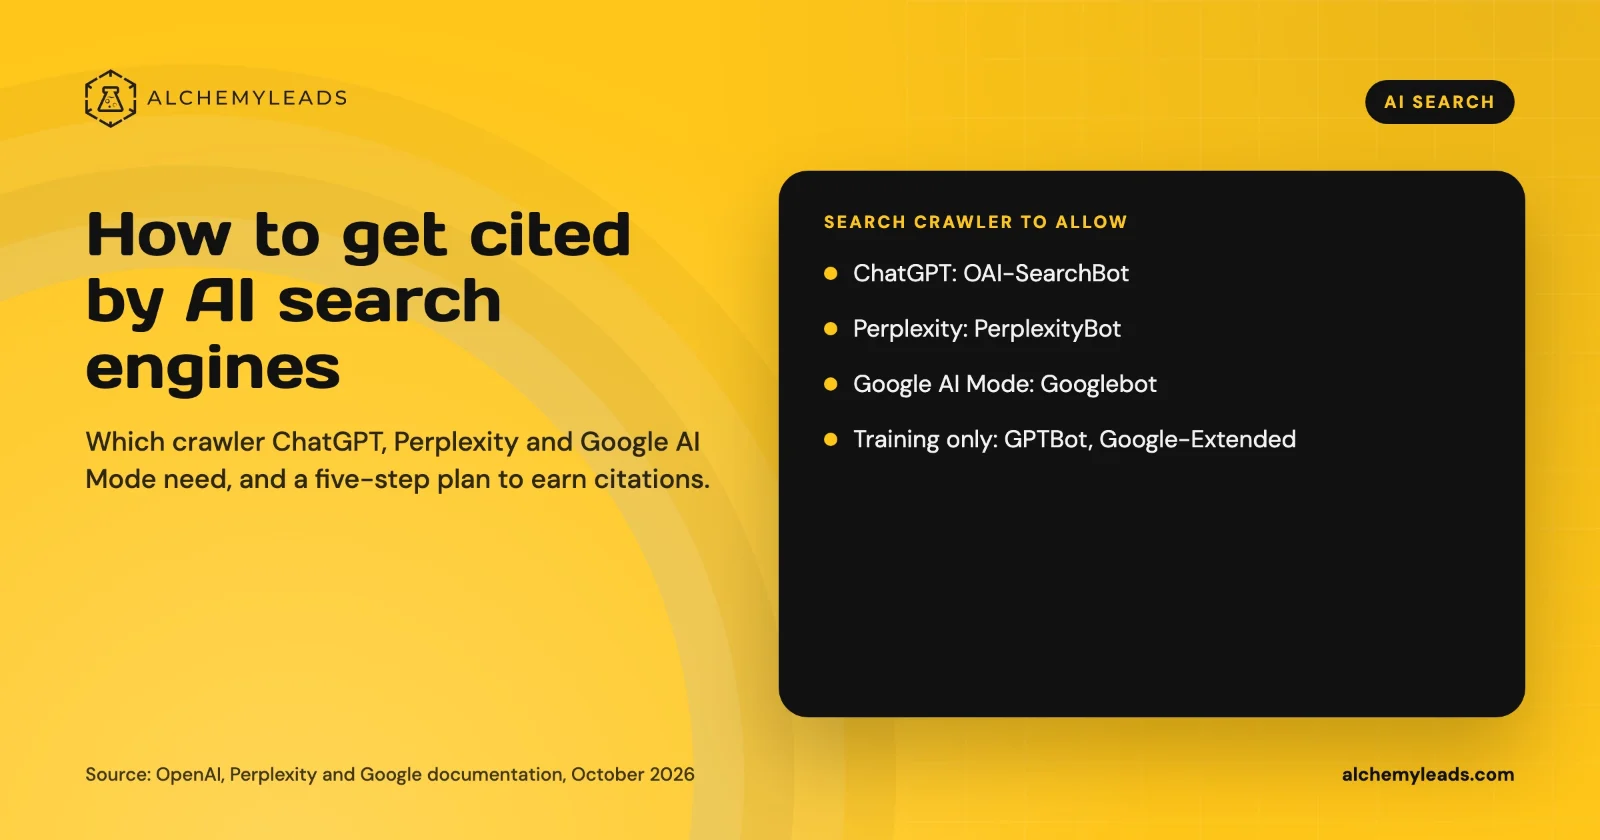
How to Get Cited by ChatGPT, Perplexity and Google AI Mode
How ChatGPT, Perplexity and Google AI Mode choose sources, which crawlers to allow, and a five-step plan to get your company cited, based on official docs.
October 26, 2026
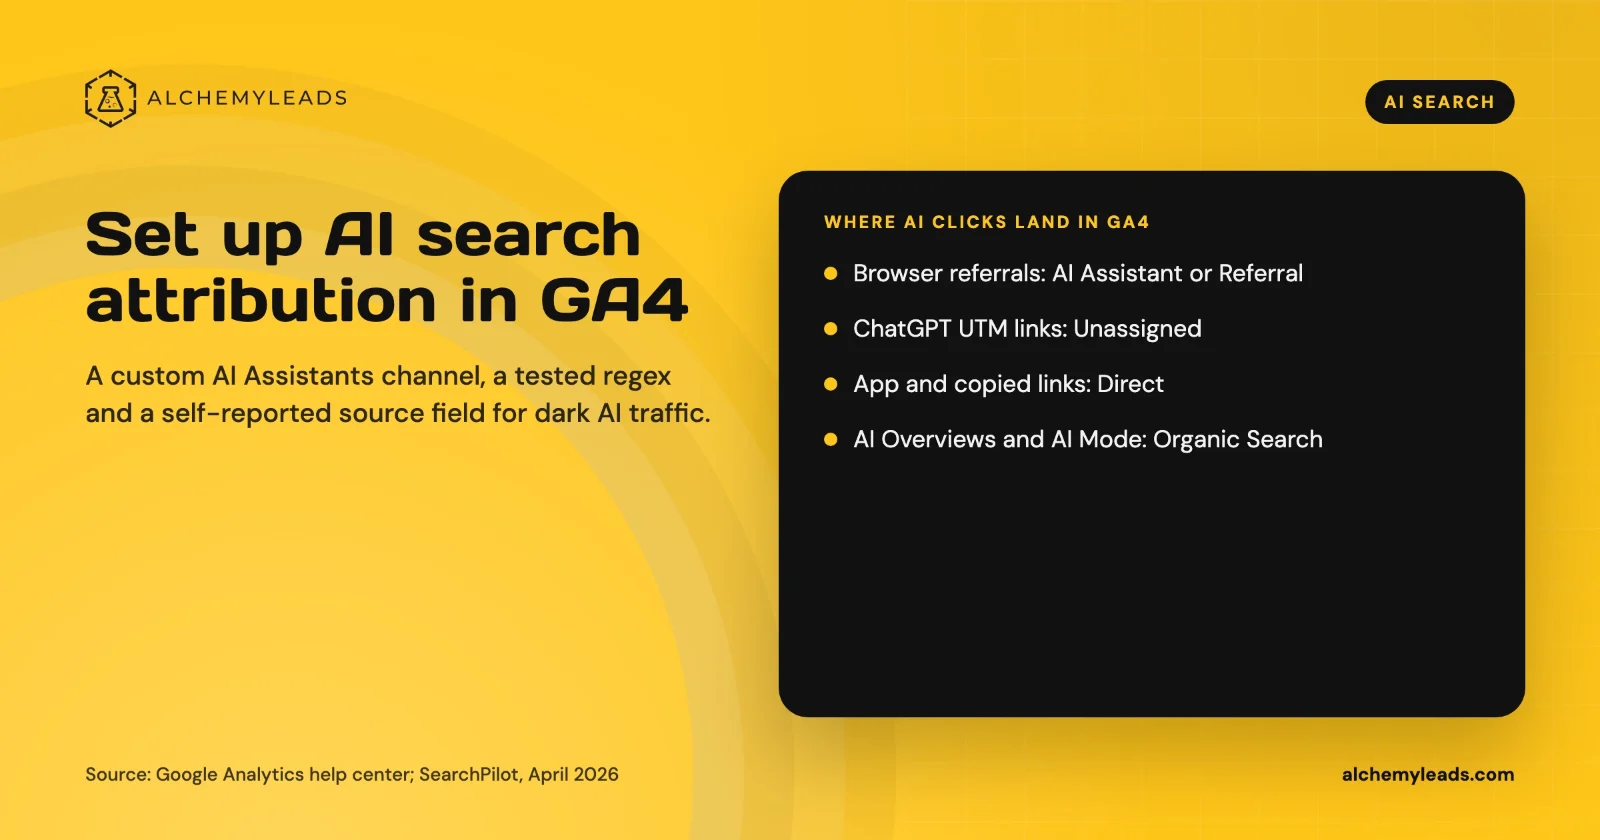
How to Set Up AI Search Attribution in GA4: A Step-by-Step Guide for 2026
Step-by-step GA4 setup for AI search attribution: an AI Assistants channel, a copy-paste regex, ChatGPT UTM fixes and a self-reported AI source field.
October 26, 2026
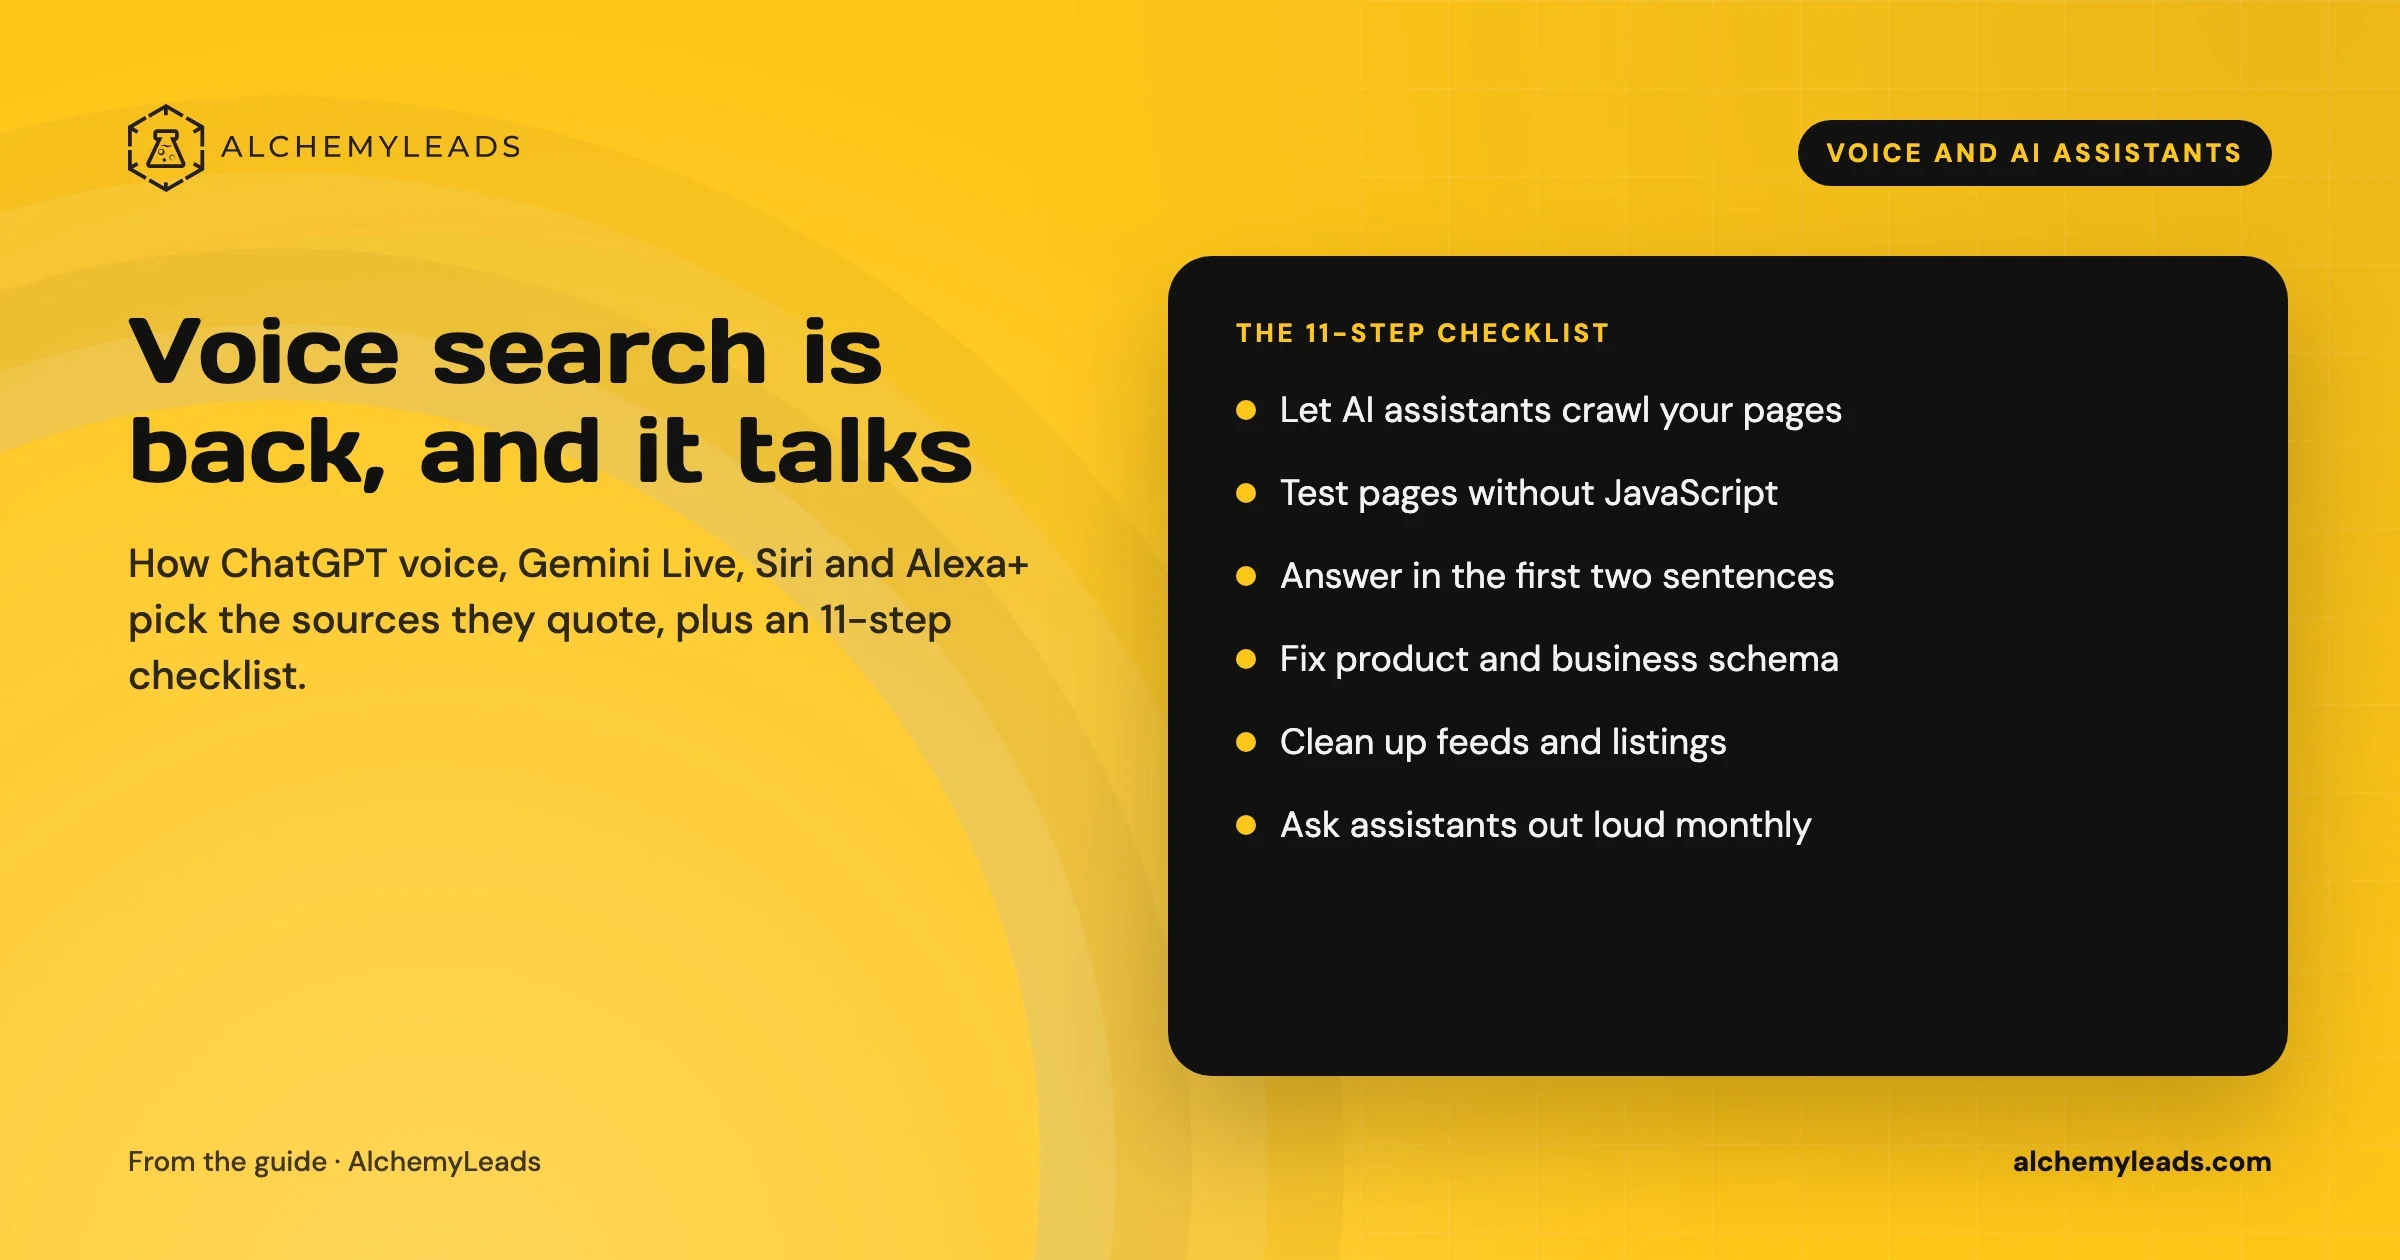
Voice Search in 2026: How AI Assistants Pick Their Sources
We first wrote about voice search in 2022, when the question was whether “Hey Siri” and “OK Google” would change how people shop. Four years later, voice is back in a bigger form. People now talk to ChatGPT, Gemini, Siri, Alexa+ and Copilot the way they talk to a knowledgeable friend, and those assistants answer by reading the web in
October 17, 2026
Contact us
We value your privacy and won't share your email with others.
We'll only contact you with curated content.
