Google Analytics for Shopify Stores: Everything You Need to Know
You opened a Shopify store, which has started showing some signs of gaining traction. Your most significant challenge is knowing how your customers use the store. This involves finding out how much time they spend browsing in your store, then interpreting this information to improve your business. The challenge of a typical brick-and-mortar store becomes easier because you can ask the customers’ opinions on your products, the checkout process, and other store aspects.
It becomes tricky with a Shopify store because your customers are virtual and could be thousands of miles away. Even if you get the information you seek, how can you leverage it to improve your store? To provide your customers with a premium shopping experience, you need to know what they want. You can quickly achieve this via Google analytics.
Shopify Analytics Vs. Google Analytics
You may be aware that you can use the Shopify analytics platform or Google analytics, famous for cross-industry reports. Both these analytics platforms provide some benefits, with each having unique features.
However, the difference is that Shopify analytics is intensely wanting because it does not offer you invaluable insights needed for making informed decisions. Most Shopify users use the Shopify native analytics report that the Shopify analytics records a lower number of visitors compared to Google.
This is due to the differences in how both record and track your site visitors. However, the major deal-breaker is that Shopify customer reports have a limit of 30,000 users. Suppose your store has grown beyond this number. In that case, you need to switch to Google Analytics for more in-depth reporting that will give you an edge over your competitors.
What is Google Analytics Used For?
The best place to start is to know what exactly Google Analytics is used for. Knowing the basics and the inner workings of the tool will help you understand exactly how it helps your eCommerce business. Google Analytics is an analytic service that provides eCommerce owners with essential tools for analysis and statistics for marketing and SEO (Search engine Optimization). This service is free for anyone who owns a Google account.
Google Analytics tracks the performance of your website and collects insights from all its visitors. It can help your business determine where your highest user traffic comes from. It can also gauge whether your marketing campaigns are doing well or discover the trends and patterns in visitor engagement.
You can also track goals such as adding items to a cart or completing purchases and obtain user demographics such as age. You can use Google Analytics to get and analyze customer behavior. This data can help you drive traffic to your site, retain visitors and improve your marketing strategy.
With this information, you are set to move forward. You do not need to be an analytics expert. This article will guide you on how to collect insights using Google Analytics 4. Google Analytics 4 is the updated version of the 2019 release. It has more advanced features such as:
Smarter AI-powered Insights and Predictions
Google Analytics has been using machine learning for a while. However, Google Analytics 4 is venturing further to detect trend changes related to your site offerings, such as demand surges, and alert you.
The new Artificial Intelligence (AI) insights will be helpful for outcome predictions such as churn rates. This information can help you anticipate your customer’s actions and take action to include the insights into your campaigns. You can also analyze visitors by grouping them or target specific audiences.
Deeper Integration with Google Ads
GA4 integrates with various Google marketing platforms to help you use the insights derived across your channels and enable you to improve your campaigns’ ROI. The Google Ads integration lets you create then maintain custom audiences from different users on your app and website. The integration also automatically adds or removes the users to and from new lists while performing various actions.
The feature also allows you to view any conversions gained via YouTube, both on the website and the app. You can also view the same on channels like email, paid search, social, organic, etc. This will allow you to gain better insights into your different marketing campaigns.
More Data Control
The Google Analytics update means you have better control of collecting, retaining, and using your Analytical data. You can choose when and how to use the data for the measurement or optimization of ads.
Customer Life Cycle Reports
The new GA4 provides you with a deeper understanding of your users’ life cycle. Platforms and devices typically fragment customer measurements. This new platform offers a customer-oriented measurement that gives you a complete view of all the user interactions.

Challenges Facing Shopify Analytics
You are bound to come across several challenges while using Shopify, such as finding out:
- Shopify marketing strategies driving the highest sales
- The organic landing sites that drive the most sales
- The organic landing pages with the most potential to improve sales
- Where potential customers drop off
- How to accurately calculate LTV (Lifetime Value) in Shopify
- The definition of who is the most interested in your products
Shopify Marketing Strategies Driving the Highest Sales
A Google Analytics acquisition report will quickly show you the marketing efforts with the most sales. This acquisition report shows you how the users find their way to your site. You can see how every acquisition channel levels up when you break them into various metrics such as conversion rates, average order values, and revenue.
The report enables you to identify which channels you need to change marketing strategies for. You may have to improve or minimize marketing efforts for some channels depending on their performance.
To get the acquisition report, you need to:
- Sign in to your Google Analytics 4 account
- Go to Life Cycle on the left-hand column and click on Acquisition, then User Acquisition
- Set the date range and set the segment to “First User.”
Segmenting in step 3 will depend on your marketing campaign setup. For instance, “First user medium” will indicate the medium that led the user to your store for the first time. Suppose you are running manual or Google Ad campaigns. In that case, the “First User campaign” indicates the marketing campaign that won the user over.
The Organic Landing Sites That Drive The Most Sales
You can use the Organic Traffic Landing Page report to see the organic landing pages with the highest traffic. This data dramatically benefits your content marketing funnel.
To get an Organic Traffic Landing Page Report:
- Sign in to your Google Analytics 4 account
- Navigate to Life Cycle on the left-hand column and click on Engagement
- Next, click on Pages and Screens
- Add a comparison by creating a dimension that includes an organic session medium
- Set the date range
- Change from Page Title to Page Range
- Change All Events to Session start
- Use session start to filter by clicking on the Event Count header.
The Organic Landing Pages With The Most Potential To Improve Sales
You can measure how well your site’s Search Engine Optimization (SEO) is doing by using specific percentages to increase traffic to your pages. Marketers often sort by revenue by opening the All pages. This is not wrong per se, but there is a more efficient metric to determine which organic landing pages hold the most potential to improve sales.
The Purchase-to-view or buy-to-detail rate report displays the conversion rate ranging from the product detail views or special purchases. You increase traffic to pages with a high buy-to-detail rate and have the most potential for sales increase.
To access the purchase-to view report in Google Analytics 4, you need to:
- Sign in to your Google Analytics 4 account
- Click on Monetization, then Ecommerce purchases
- You add comparison by creating a dimension that includes session medium: organic
- Set the Date Range
- The name of the item arranges the table
- The header contains the Purchase-to-view rate, so click on it
Where Potential Customers Drop Off
To understand where potential customers drop off, use the conversion funnel visualization report. This is where you get to see where your users exit the checkout flow and their subsequent actions. This data can help you to improve your CVR (conversion rate) efforts. The report will populate once you set up conversion and event data in the new GA4 version.
To access the conversion funnel visualization report, you should:
- Sign in to your account
- In the column of the far-left, click Explore
- Click on Funnel Exploration, which will display a sample of the report
- Remove the Steps by clicking on the Pencil icon. View_item, then add_to_cart, and finally purchase.
In the Funnel Exploration, you get numerous report features such as telling how long a user takes to complete a step and trend visualization over time. It also enables you to see the activity of users who drop out of the funnel.
To get the most of your GA4, explore the array of features and segment comparisons. If you notice a significant drop-off in the purchase or add to cart, you no longer need to wonder what the user is doing. The funnel exploration report allows you to add another feature for the following action or event name. When you right-click on that step on your report, it shows you a percentage of the actions taken when the user dropped off.
How To Accurately Calculate LTV (Lifetime Value) In Shopify
By calculating the average lifetime value (LTV) of your users, it is easier to set the Cost per Action (CPA and the Return on Investment (ROI) goals for each user. For instance, if your average customer spends $1500 per year’s subscription and is a customer for at least four years, their average LTV is $6,000. You can easily spend between $400 and $800 per customer because their value will pay off eventually.
GA4 ‘s Lifetime Value report makes it possible to tell which of your campaigns are performing within your CPA and RPI targets per customer. To access the LTV report:
- Sign in to your account
- On the far-left menu, click Explore
- Click on Template Gallery, then click on User Lifetime template
The Definition Of Who Are The Most Interested In Your Products
A user journey report will tell you the most interested users in your products and are likely to buy. It also shows you how the various marketing channels liaise to lead users from the first step to the last.
This report shows you which channels are pushing events at the top of the funnel and how these affect activities in the lower funnel. To access the User Journey Report in GA4:
- Sign in to your account
- Click on Custom Reports, then Create New Report
- Put the Title Report as Custom User Journey
- Add report Tab and name it as Report Tab, with the type as Flat Table, and dimensions as Source/Medium
- Metrics: Custom Metrics, Sessions, Ecommerce CVR, Buy-to-Detail rate, and Transactions.
The trick is to focus on the percentage-based metrics, not only raw event values. This implies that you must include the custom metric conversion rate, not the number of goal completion. For instance, you might find out that the users via your Instagram bio referral have significant email signup and that emails have a considerable percentage of checkout initiation. You may consider investing more resources to improve your site’s Instagram email marketing funnel from this information.
Conclusion
When your customers visit your site, they leave a lot of information. When you leverage this information, you can make better marketing decisions. Using the GA4 for your Shopify store may seem like a technical task, but you do not need any analytical skills to do it. You can use the reports on this guide to gain in-depth insights into how your customers land on your site in the first place. You can also learn why potential customers are dropping off without converting and how you can create an attractive customer journey to net great loyal customers.
Suggested
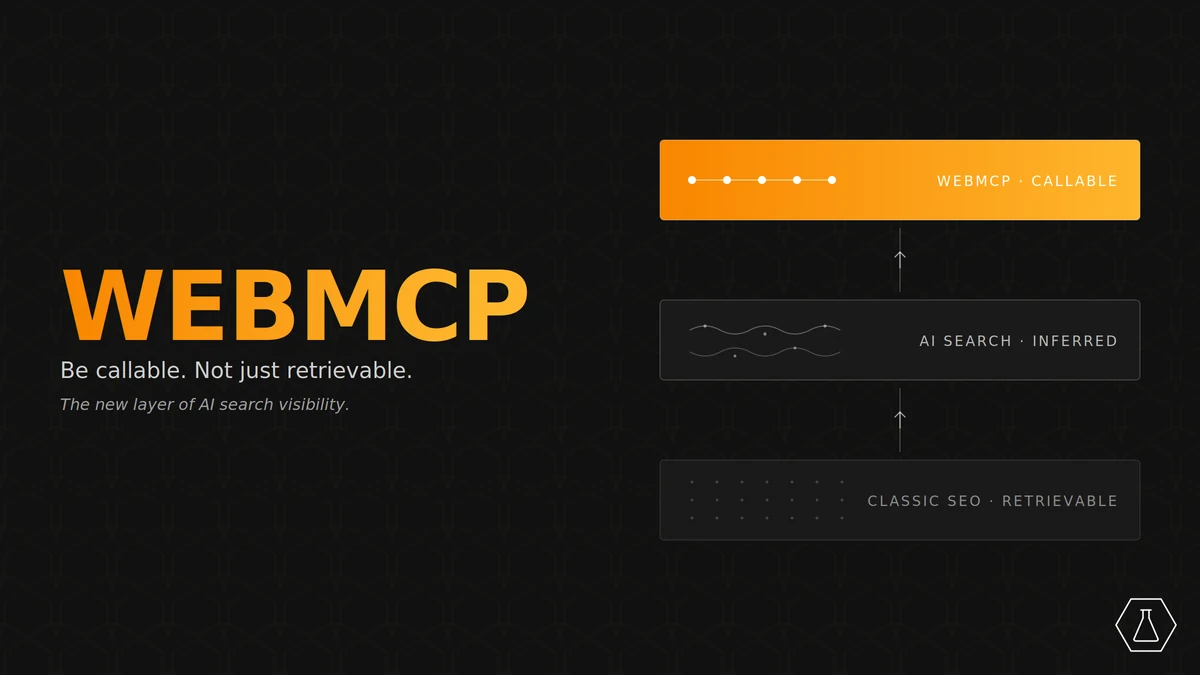
WebMCP for SEO: What It Means When AI Agents Call Your Site
AI search picks sources differently now. The old model was simple. Be retrievable. Make sure crawlers can find your content, build authority through links, structure your pages so they rank. That model still works. It’s no longer the only one operating. A second layer has shipped on top. AI agents can call your site directly, the same way a developer
May 27, 2026
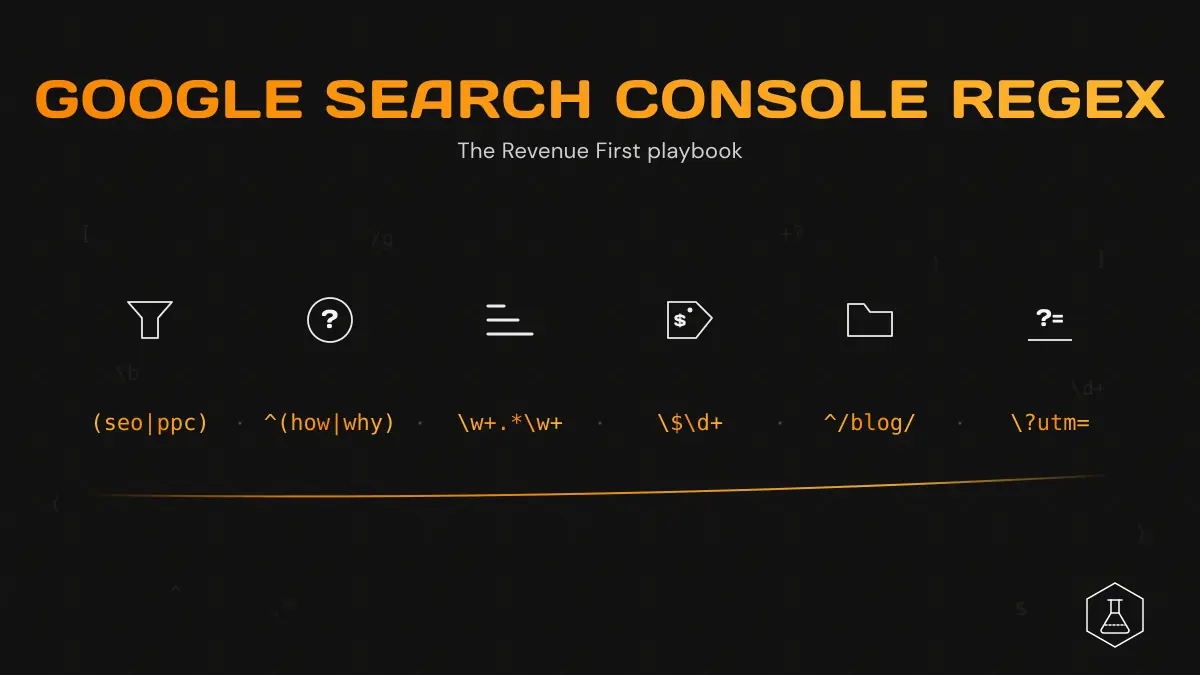
Google Search Console Regex: The Revenue First Playbook
Google Search Console regex isn’t just a syntax puzzle. Get the 6 patterns that earn their keep and the revenue moves they trigger.
May 27, 2026
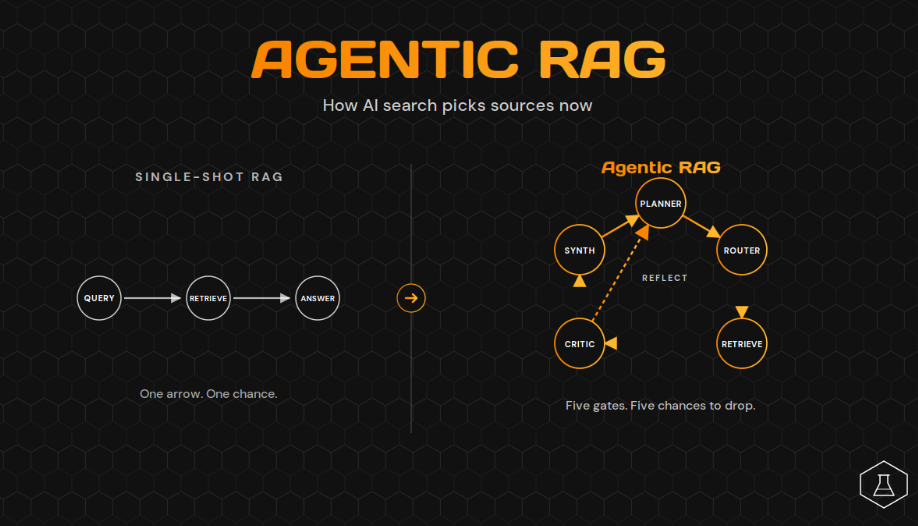
Agentic RAG: How AI Search Picks Sources Now
The retrieve-once-then-generate model that defined the first wave of AI search is over. Every major AI search platform has moved on. Google AI Mode, ChatGPT Search, Perplexity Pro Search, Claude with Computer Use, and the Microsoft Copilot agents all run a different architecture now. They plan. They route between tools. They retrieve, read, then retrieve again. They grade their own
May 22, 2026
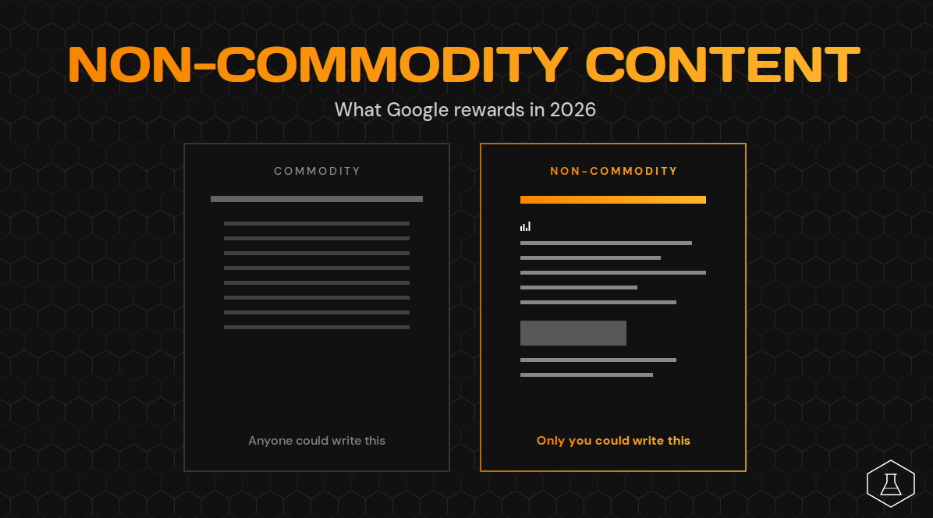
Non-Commodity Content
Google just gave the SEO industry a new term. Non-commodity content. Danny Sullivan introduced it at Search Central Live Toronto in April 2026, and Google’s updated AI Search guide put it in writing in May. The framing is sharp. Commodity content is anything someone with a content brief and an internet connection could write. Non-commodity content is the stuff only
May 20, 2026
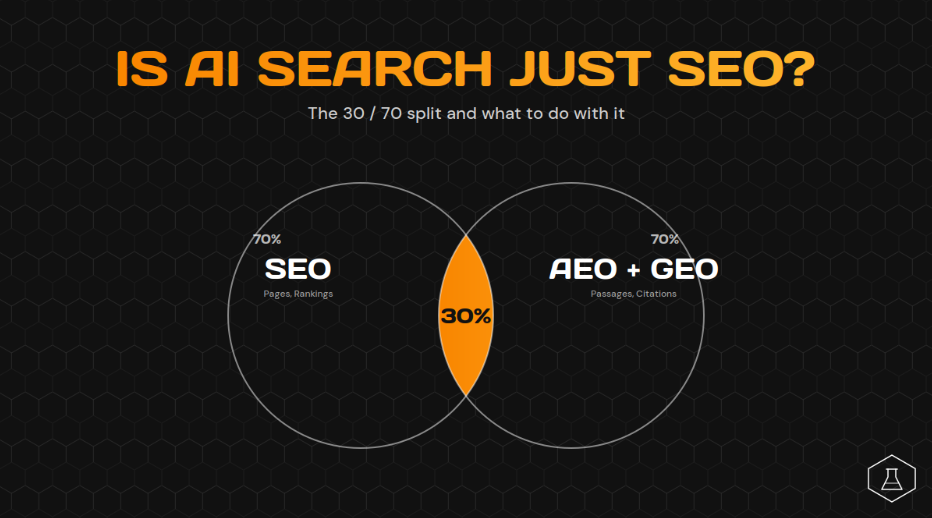
Is AI Search Just SEO? The AlchemyLeads Take
Is AI search just SEO? Half the industry says yes. The other half says no. Google says it’s all still SEO. Microsoft has been publishing posts that call it Generative Engine Optimization. Rand Fishkin at SparkToro pushes back on the new acronyms entirely. Two vendors have probably pitched you “GEO services” this quarter. Here’s the honest answer. Yes and no.
May 20, 2026
Contact us
We value your privacy and won't share your email with others.
We'll only contact you with curated content.